Premium Reports
ShipMatrix offers premium reports that provide a full breakdown and detailed analysis of your shipping operation.
Service Performance Benchmark Summary
The service performance benchmark summary report provides detailed breakdowns of on-time performance, package delays, and zone distribution all in one dashboard.
On-Time-Performance
In this report you will find maps of the US, Canada, Europe, and Asia displaying on-time-performance by state, province, or country.
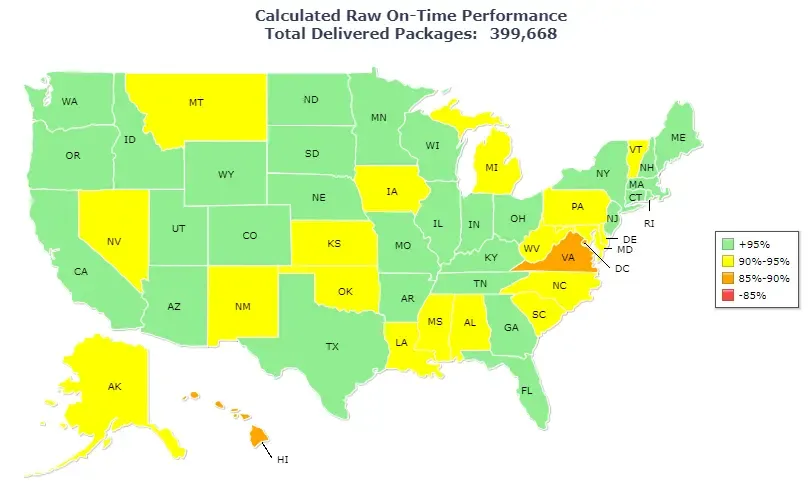
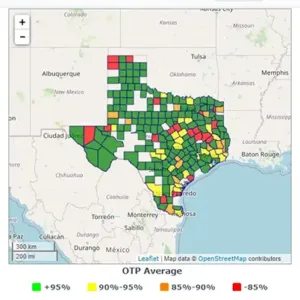
In the US map, you can drill down by state to view OTP values by county or zip code.
On-time-performance can also be viewed by service type.

Package Delays
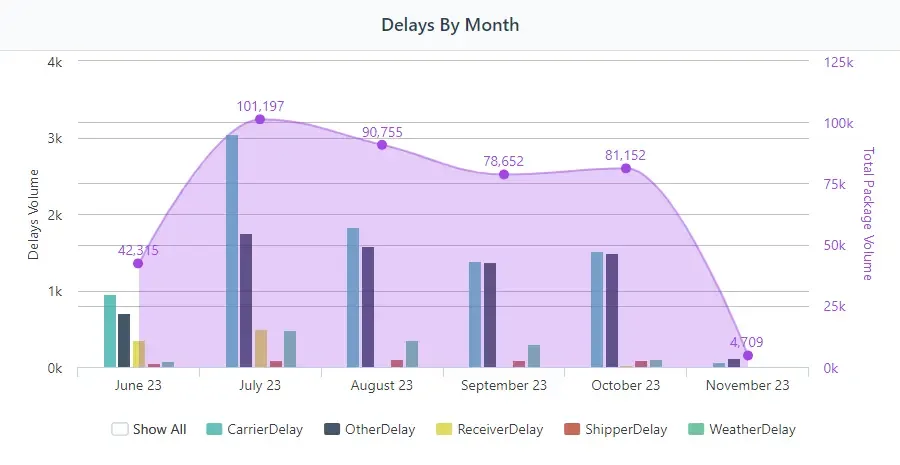
Discover the volume of delayed packages per month compared to total shipping volume. This report also provides insight into delay reasons, providing you an opportunity to help improve your OTP.
Zone Distribution
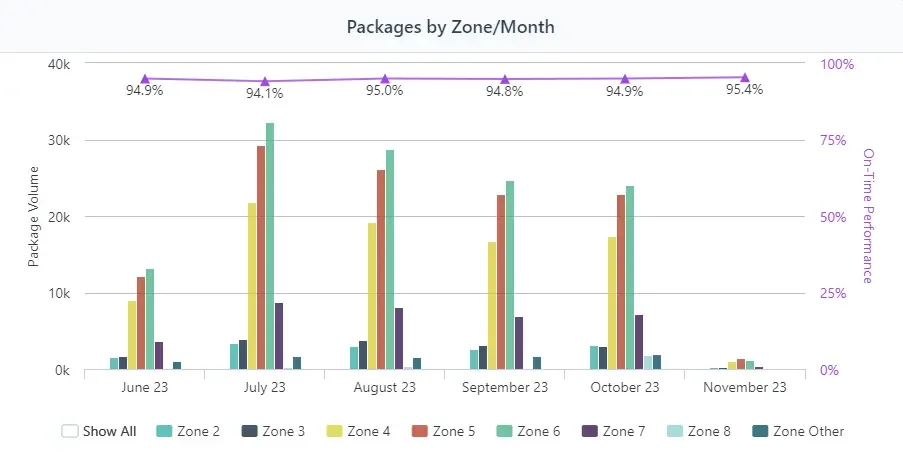
The packages by zone/month graph provides a breakdown of shipments by zone per month, as well as monthly OTP.
You can also drill into any month to find OTP values by zone for the given month.

Cost Per Package Report
The cost per package (CPP) report creates a detailed Microsoft Excel file packed with filterable graphs and charts. This report provides insight into overall CPP as well as CPP by accessorial, service level, freight, and fuel. In addition, you'll find data on total monthly freight and fuel costs as well as an accessorial summary.
Per Package Breakdown
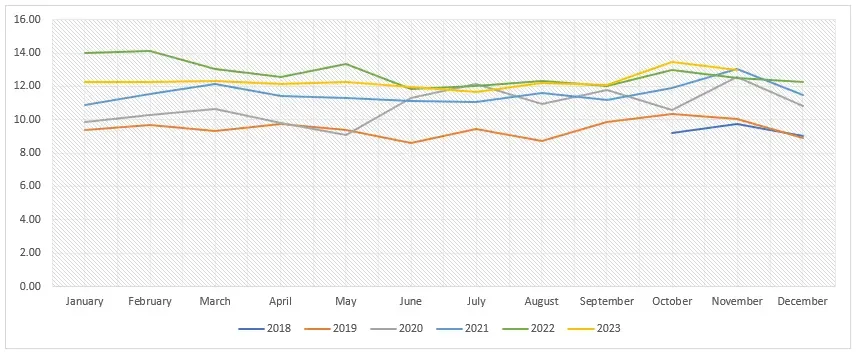
The report contains graphs and charts similar to these for overall CPP, as well as freight, fuel, accessorial, and service level.
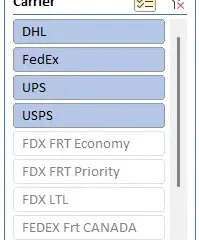
The reports are also filterable by carrier.

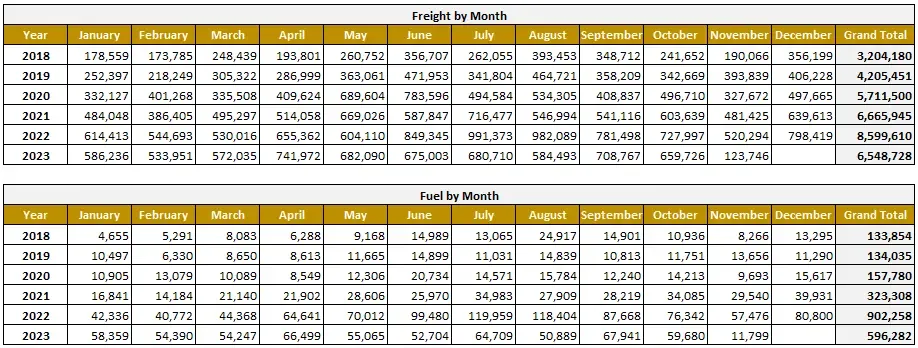
Monthly Freight & Fuel
Review your freight and fuel spending by month and year.
Accessorial Summary
You'll also gain a detailed breakdown of various accessorial charges by month and year.

